Feedback from our customers is important to everyone at Hightown.
Every year we're required to report back to the Regulator of Social Housing on the work we do and what our customers think about it. We're also required to publish that information so that you can see where we're doing well, and where we need to improve. The Regulator calls this information Tenant Satisfaction Measures (TSMs).
Here you can find out more about:
- What are Tenant Satisfaction Measures (TSMs)?
- Our TSM results for 2024/25
- Making improvements
- Our TSM approach
The Tenant Satisfaction Measures (TSMs) have been introduced by the Regulator of Social Housing in England to measure how well social landlords are performing on the key areas that matter most to customers.
These measures have been designed to drive up standards and improve the quality of social housing by ensuring housing providers are accountable for the services they deliver.
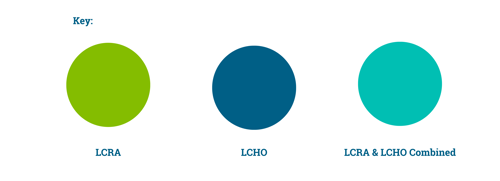
The TSMs cover two categories: Low Cost Rented Accommodation (LCRA), covering customers who rent, and Low Cost Home Ownership (LCHO), covering shared owners.
The measures focus on the following key themes:
- Keeping properties in good repair
- Maintaining building safety
- Respectful and helpful engagement
- Effective handling of complaints
- Responsible neighbourhood management
There are 22 measures; 12 are perception measures and come directly from customer surveys carried out on our behalf by an independent research company, Acuity. The remaining 10 come from management information we hold about our operational activity.
Thank you to all those customers who took part in our 2024/25 perception survey.
For more information on the Tenant Satisfaction Measures, please visit Tenant Satisfaction Measures – Summary of RSH requirements (accessible) – GOV.UK (www.gov.uk).
The results below show how we performed in 2024/25 across the Tenant Perception Measures for both low cost rented accommodation (LCRA) and low cost home owners (LCHO) and across the peformance measures that we measure directly.

Overall satisfaction
TP01
LCRA: Satisfied with the overall service we provide
TP01
LCHO: Satisfied with the overall service we provide
Keeping properties in good repair
TP02
LCRA: Satisfied with repairs service
TP03
LCRA: Satisfied with time taken to complete most recent repair
TP04
LCRA: Satisfied your home is well maintained
RP01
LCRA: Homes that meet the Decent Homes Standard
RP02 (2)
LCRA: Emergency responsive repairs completed within target timescale*
RP02 (1)
LCRA: Non-emergency responsive repairs completed within target timescale*
* Emergency repairs target timescale is 24 hours. Non-emergency repairs target timescales are 3 days for urgent repairs and 20 days for routine repairs.
Maintaining building safety
TP05
LCRA: Satisfied your home is safe
TP05
LCHO: Satisfied your home is safe
BS01
Gas safety checks up-to-date
BS02
Fire risk assessments up-to-date
BS03
Asbestos safety checks up-to-date
BS04
Legionella risk assessments up-to-date
BS05
Communal passenger lift safety checks up-to-date
Respectful and helpful engagement
TP06
LCRA: Satisfied we listen to your views and act on them
TP07
LCRA: Satisfied we keep you informed about things that matter to you
TP08
LCRA: Agreement we treat customers fairly & with respect
TP06
LCHO: Satisfied we listen to your views and act on them
TP07
LCHO: Satisfied we keep you informed about things that matter to you
TP08
LCHO: Agreement we treat customers fairly & with respect
Effective handling of complaints
TP09
LCRA: Satisfied with our approach to handling complaints
CH01 (1)
LCRA: Number of Stage 1 complaints received per 1,000 homes
CH01 (2)
LCRA: Number of Stage 2 complaints received per 1,000 homes
CHO2 (1)
LCRA: Stage 1 complaints responded to within Complaint Handling Code timescales
CHO2 (2)
LCRA: Stage 2 complaints responded to within Complaint Handling Code timescales
TP09
LCHO: Satisfied with our approach to handling complaints
CH01 (1)
LCHO: Number of Stage 1 complaints received per 1,000 homes
CHO1 (2)
LCHO: Number of Stage 2 complaints received per 1,000 homes
CH02 (1)
LCHO: Stage 1 complaints responded to within Complaint Handling Code timescales
CH02 (2)
LCHO: Stage 2 complaints responded to within Complaint Handling Code timescales
Responsible neighbourhood management
TP10
LCRA: Satisfied we keep communal areas clean and well maintained
TP11
LCRA: Satisfied we make a positive contribution to neighbourhoods
TP12
LCRA: Satisfied with our handling of anti social behaviour
TP10
LCHO: Satisfied we keep communal areas clean and well maintained
TP11
LCHO: Satisfied we make a positive contribution to neighbourhoods
TP12
LCHO: Satisfied with our handling of anti social behaviour
NM01 (1)
Number of anti-social behaviour cases opened per 1,000 homes
NM01 (2)
Number of anti-social behaviour cases that involve hate incidents opened per 1,000 homes

Making improvements
We're always looking at ways we can improve our performance. As well as publishing our Tenant Satisfaction Measures scores, we also have a plan for how we'll improve them based on your feedback.
Read more-

Read our summary of approach to find out how we carrried out our 2024/25 customer perception survey and calculated the results


